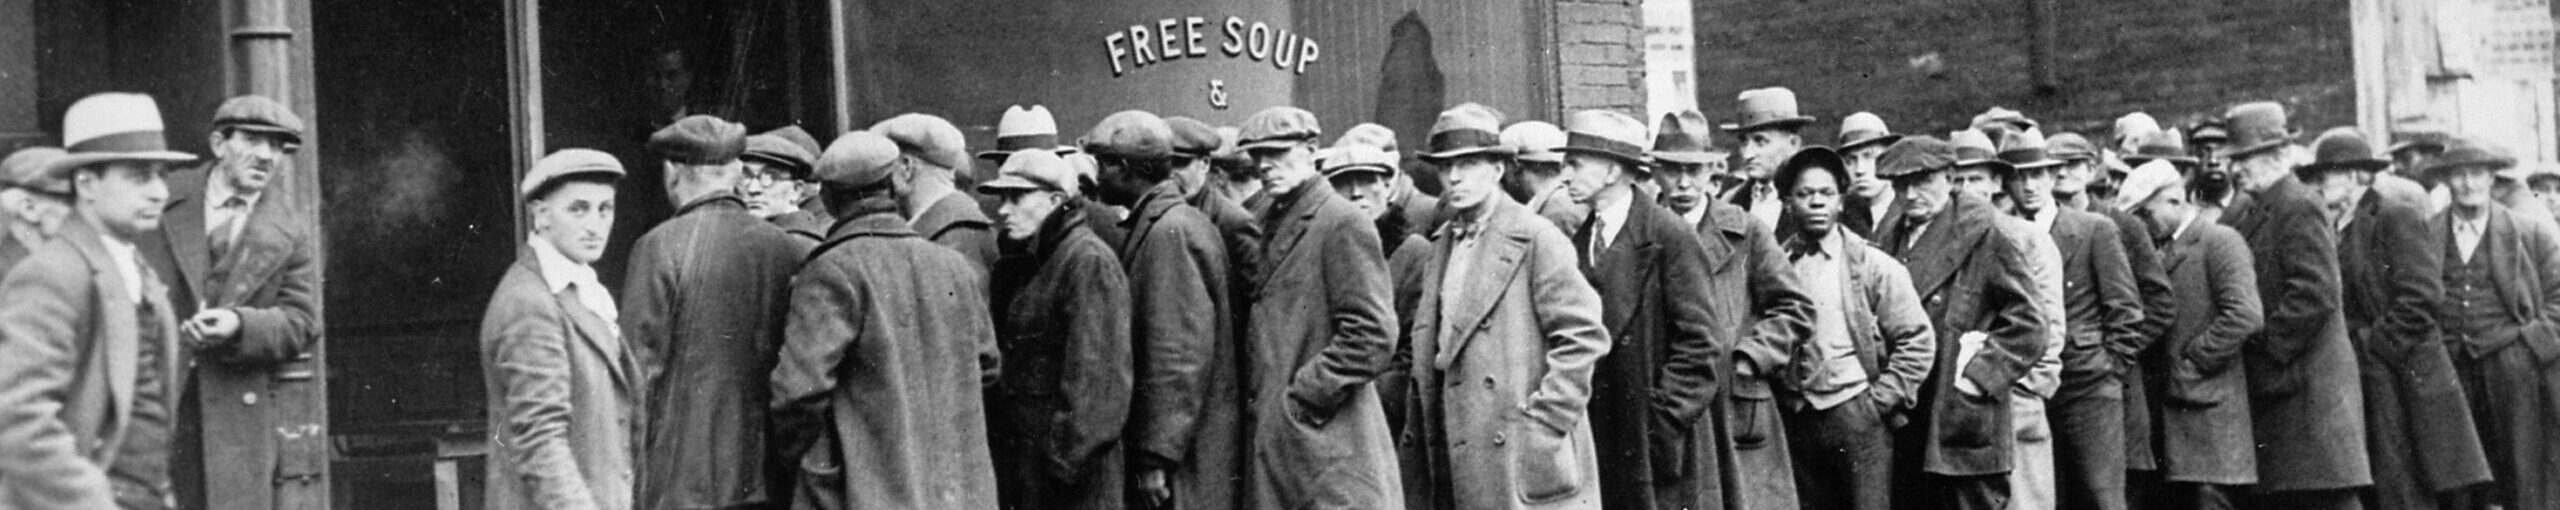
How Has Homicide Changed in Chicago Between 1909-1919 and 2009-2019?Chicago has always been a hotbed of crime, especially gang violence. The Black Hand, Northside Gang, and the Chicago Outfit were well known and feared organizations in the turn of the century, and this legacy of crime has not been forgotten or removed in Chicago today.
Introduction and Methodology
This project seeks to show that homicide has changed in Chicago between 1909-1919 and 2009-2019, and more importantly, how homicide has changed. This project seeks to find out who is committing murder, and a brief explanation of why it may be happening like it is. The explanation will be brief because the time allotted to the research of this paper does not allow for an in depth look into the myriad of reasons for the shifts in, and causes of, the homicide in Chicago. Sociologists have dedicated their careers to trying to understand the arcane nature of crime in Chicago, so only a modest explanation can be provided. This project will not be reviewing the victims of crimes, only the perpetrators. While the story that the victims will tell would be interesting, this projects seeks to understand who is committing crime, not who the crimes is being committed against. The method for which the research was conducted was taking the Chicago Homicide Database and cleaning the data for Defendant Race and Gender. Then removing all non-intentional, or non-hostile crimes that resulted in deaths. This means that accidental deaths, unintentional manslaughters and suicides were removed. Intentional manslaughter was included by the FBI in their statistics, with the justification that intentional manslaughter is still the purposeful taking of life, so due to the desire to remain consistent, this was added. Further, infanticide was included in with the data cleaned from from the Chicago Homicide Database as it fits the stated intent of the FBI homicide statistics mention above. It is not stated whether or not infanticide is included in the homicide data, which may result in slight skewing of the data, but the amount of infanticides is relatively negligible. Finally, the category in the Chicago Homicide Database known as “Cause of Death Unknown” and homicides without a data entry for a reason were included which also might skew the data, for instance, the coder of the database put in an entry of “Cause of Death Unknown” as, “Died from natural causes” while another entry was, “run down by auto.” To remain consistent, no entries were removed either blank entries or “Cause of Death Unknown” entries. With that out of the way, here are the findings:
How Much Homicide Is Happening?
The first thing that was observed was the significant increase in homicides between 1909-1919 and 2009-2019. While it could be blamed on population increase, Chicago in 1910 had a population of 2,185,283 while in 2010 Chicago had a population of 2,695,598. That is an increase of 23.4% in population. It should be noted that in 1910, Chicago was the second largest city in the United States, and it was significantly lower in 2010.1Population of Chicago, IL, Population.us, 2016. Accessed from: https://population.us/il/chicago/ Additionally, Chicago has been in a decline in population since the 1950s which explains why there is only a modest increase a century later. However, the total amount of recorded homicides in the period of 1909-1919 was 2,262, while in 2009-2019 the amount of recorded homicides was 8,257.2 Leigh Beinen, Homicide in Chicago, 1870-1930. Evanston, Illinois: Northwestern University, 2019. Accessed from: https://arch.library.northwestern.edu/concern/generic_works/pz50gw2623 FBI, Crime Data Explorer, Clarksburg West Virginia: Federal Bureau of Investigation. Accessed from: https://crime-data-explorer.fr.cloud.gov/explorer/state/michigan/shr. That is a 265% increase in homicides! A mere increase in population does not justify the massive rise in homicide in the city of Chicago.
Which Sex Commits the Most Homicide?
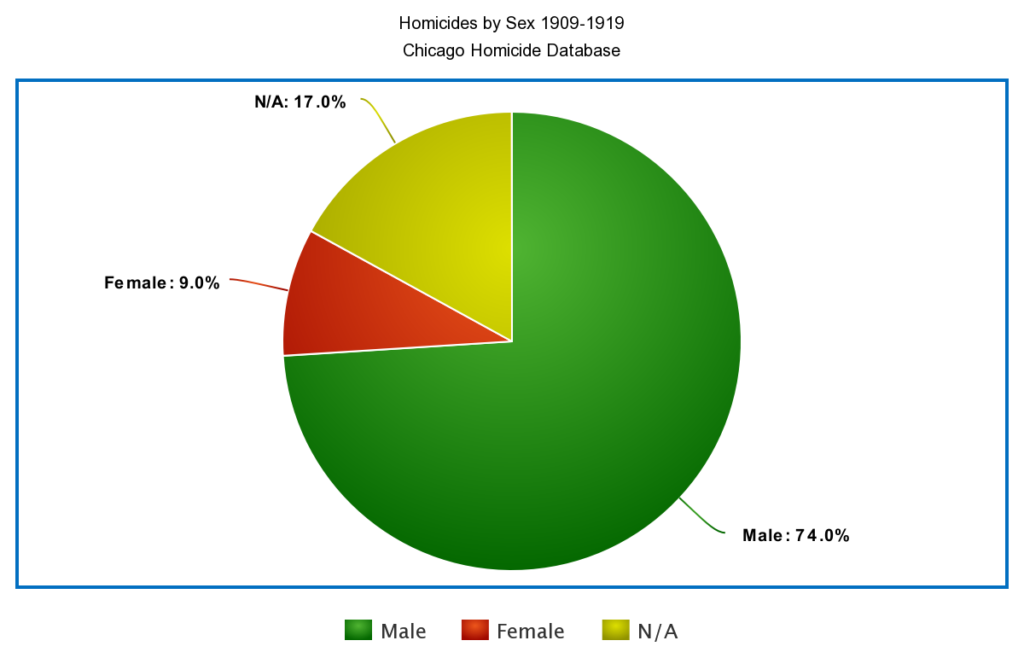
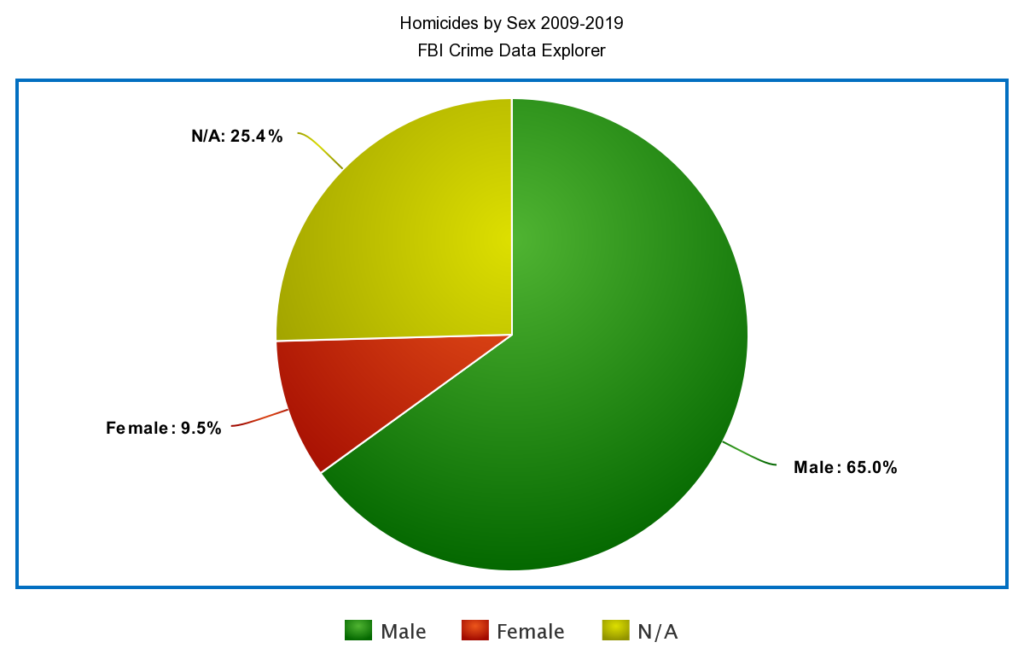
There is no surprising answer here, males by far committed the majority of homicides in both periods. What is interesting, however, is that females stayed around the same in both periods. In 1909-1919 females accounted for 9% of all murderers, and in 2009-2019, females accounted for 9.5% of murderers. Males, however, vary quite significantly. Males are responsible of 65% of murders in 2009-2019, while being responsible of 74% of murders in 1909-1919. This large variation occurred because of the Unknown, or not applicable statistic. The FBI reported a far more muddled record for 2009-2019 than the Chicago Police Department in 1909-1919, with the 25.4% and 17% respectively. This issue of unknowns is something that plagues the FBI’s database, and is going to be a problem going forward. These findings, as stated above, are not surprising. Males historically have always committed the most crime, especially violent crimes and murder. So, these findings are par for the course.
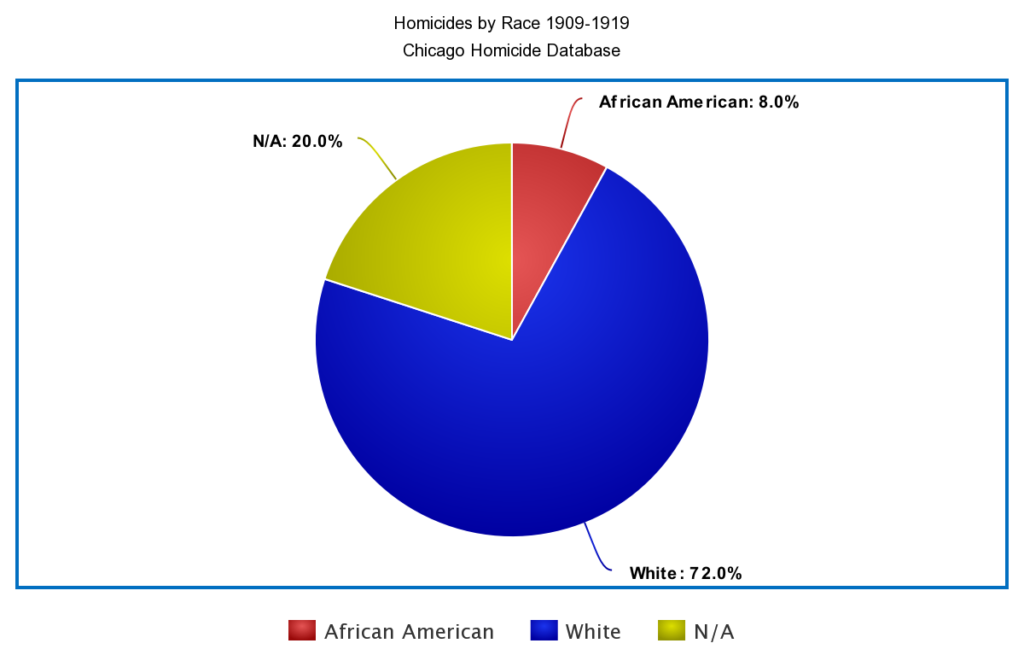
Which Race Commits the Most Homicide?
Here, an initially shocking reversal occurs. Between 1909 and 1919, Whites accounted for 72% of all murderers, with African Americans accounting for just 8%, with the remainder 20% being unknown. Between 2009-2019, African Americans accounted for 53.2% of Murderers, with Whites accounting for 18.9% of murderers, and an even larger 27.9% being of an unknown race. An important thing to note about the FBI database is that they do not separate Latinos from Whites, and as such a more accurate picture is not available. As stated previously, this is quite a shocking turn. African Americans jumped 565% in murderers, while Whites decreased 73.75%. Thankfully, this massive shift can be displayed by population change. Chicago in 1910 was dominated by Whites, who naturally then committed more crime, and in 2010, African Americans dominated Chicago. One can gain a very clear picture at the population change from the University of Illinois at Chicago’s Chicago Area Geographic Information Study, who compiled a graphic showing this change in population make up, shown below.
Credit to the University of Illinois at Chicago’s Chicago Area Geographic Information Study for this image.
While cutting off in 2000, it is relatively clear that the population makeup of Chicago had nearly completely changed by that point, and so the significantly higher African American crime rate is explainable by this.
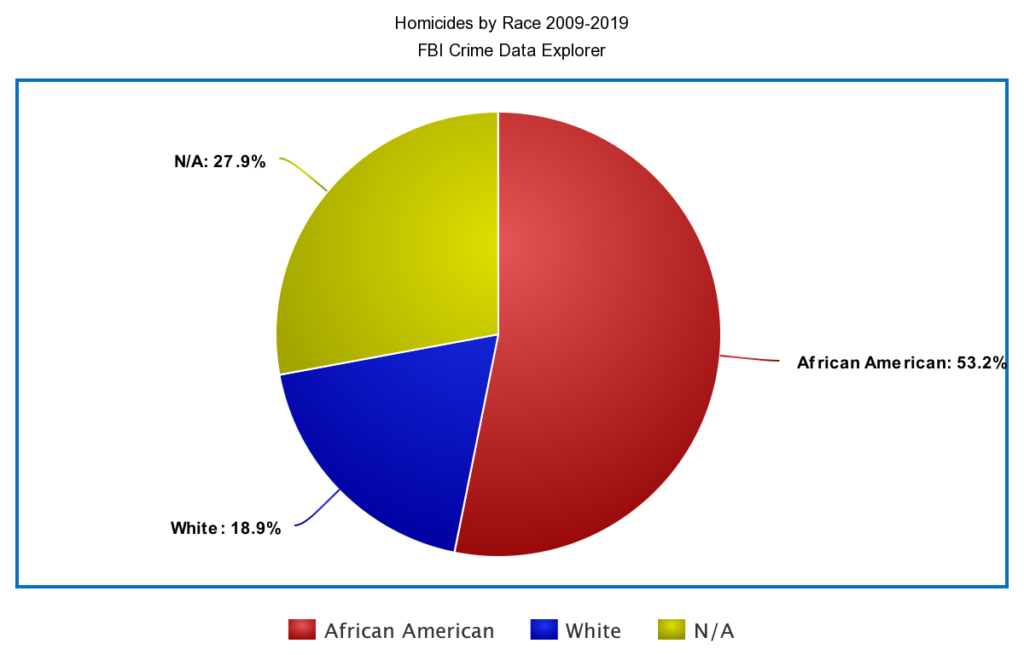
Note: The 2009-2019 figure does not fully add up to the 8,257 total of homicides as only White, African American, and Unknowns were considered, the total pictured here is 8,231.
Why Has Homicide Changed in Chicago?
As stated in the introduction, this is an arcane subject that cannot be fully explored here, however, some interpretation and extrapolation of the data will occur with reference to veterans in the field. Obviously, a major population shift occurred. This is especially blatant in the figured provided by the University of Illinois, and this explains why African Americans now proportionately commit more crime than anyone else in the city. However, this change in population does not explain the huge increase in the number of homicides, from 2,262 in 1909-1919 to 8,257 in 2009-2019.4 Leigh Beinen, Homicide in Chicago, 1870-1930. Evanston, Illinois: Northwestern University, 2019. Accessed from: https://arch.library.northwestern.edu/concern/generic_works/pz50gw2625 FBI, Crime Data Explorer, Clarksburg West Virginia: Federal Bureau of Investigation. Accessed from: https://crime-data-explorer.fr.cloud.gov/explorer/state/michigan/shr. In fact, this 265% increase is breathtaking in all the wrong ways.
How could Chicago see nearly triple the amount of homicides in a hundred year period? An immediate answer is one that the courts ruled differently then and now. Which is true, only 20% of homicides saw a conviction in 1910. It is unclear what Chicago’s conviction rate was in 2010, but it is very likely higher than a mere 20%.6Jeffery S. Adler, “It Is His First Offense. We Might as Well Let Him Go,” Homicide and Criminal Justice in Chicago, 1875-1920.” Journal of Social History 40, no. 1 (2006): 9. http://www.jstor.org/stable/4491854. In any case, the homicides are based off reported homicides, and not convictions, so while this can influence repeat offenders in one way or another, they do not directly affect the numbers.
Obviously, this population change did not occur in a vacuum, people had to migrate or immigrate to Chicago. This is an important and interesting concept, because Chicago has always been a city of immigrants. And it is this immigration that has lead to large changes in crime in Chicago.7John M. MacDonald, John R. Hipp, and Charlotte Gill, “The Effects of Immigrant Concentration on Changes in Neighborhood Crime Rates., Journal of Quantitative Criminology 29, no. 2 (2013): 191-215. http://www.jstor.org/stable/43551955. When one thinks of Chicago’s history, they think of the Italian crime bosses that plagued the city during the 20s and 30s. Immigration and immigrants have always been apart of Chicago’s, and every US city’s crime.8Jeffery S. Adler, “Murder, North and South: Violence in Early-Twentieth-Century Chicago and New Orleans,” The Journal of Southern History 74, no. 2 (2008): 297-305. http://www.jstor.org/stable/27650144. So, obviously the Great Migration and its subsequent waves has greatly affected the crime rate in Chicago.
Another important thing to keep in mind while looking at this data is that it occurred after the 2008 market crash, and that the data its being compared against is pre-Great Depression. As such, bank investments and loans have a major impact on how neighborhoods are able to develop, and this development, or lack thereof, leads to increases and decreases in crime. 9Maria B Vélez, and Kelly Richardson, “THE POLITICAL ECONOMY OF NEIGHBOURHOOD HOMICIDE IN CHICAGO: The Role of Bank Investment,” The British Journal of Criminology 52, no. 3 (2012): 490-494. http://www.jstor.org/stable/44173503. The majority of crime happens in poorer areas with less investment and investment opportunity, thus and since no one wishes to invest in it because of the crime and poverty, the cycle continues.
Why Chicago’s homicides have changed is something of a puzzling mystery. Obviously, demographic change has influenced it significantly, at least in the makeup of who is committing these homicide, but mere demographic change is not acceptable. Another possible contender is the investment economy and the self fulfilling loop that it reinforces, but even this on its own, or combined with demographic change, is not really satisfactory. This in combination with failed attempts by the federal government through things like Project Safe Neighborhood specifically targeting these low income neighborhoods does provide a minutely better explanation, but Unfortunately, the reasons behind the changes in Chicago homicide are hidden and no one really seems to have a great answer to it.10 Ben Grunwald, and Andrew V. Papachristos, “Project Safe Neighborhoods in Chicago: Looking Back a Decade Later,” The Journal of Criminal Law and Criminology (1973-) 107, no. 1 (2017): 131-137. doi:10.2307/48572210. Until such an answer becomes clear, many poorer Chicagoans will continue having to suffer high murder rates and a continuing poor quality of life.
Works Cited
Primary
Anonymous. Communists Attacking a Parade of Ukrainians in Chicago. Chicago, Illinois. Retrieved from: https://commons.wikimedia.org/wiki/File:Communists_attacking_a_parade_of_Ukrainians_in_Chicago._17.12.1933.jpg
Beinen, Leigh. Homicide in Chicago, 1870-1930. Evanston, Illinois: Northwestern University, 2019. Accessed from: https://arch.library.northwestern.edu/concern/generic_works/pz50gw262
FBI. Crime Data Explorer. Clarksburg, WV: Federal Bureau of Investigation. Accessed from: https://crime-data-explorer.fr.cloud.gov/explorer/state/michigan/shr
Miller, Charles Edward. Activists Protest Lincoln Yards Development Chicago Illinois. Chicago, Illinois. Retrieved from: https://commons.wikimedia.org/wiki/Category:Chicago_Police_Department#/media/File:Activists_Protest_Lincoln_Yards_Development_Chicago_Illinois_4-9-19_20190409_0068_(46860633194).jpg
Secondary
Adler, Jeffrey S. “It Is His First Offense. We Might as Well Let Him Go”: Homicide and Criminal Justice in Chicago, 1875-1920.” Journal of Social History 40, no. 1 (2006): 5-24. http://www.jstor.org/stable/4491854.
Adler, Jeffrey S. “Murder, North and South: Violence in Early-Twentieth-Century Chicago and New Orleans.” The Journal of Southern History 74, no. 2 (2008): 297-324. http://www.jstor.org/stable/27650144.
Chicago Area Geographic Information Study. Chicago Demographic Change. Chicago, Illinois: University of Illinois, 2013. Accessed from: http://www.gif-explode.com/?explode=http://i.imgur.com/xZoKnTa.gif
Grunwald, Ben, and Andrew V. Papachristos. “Project Safe Neighborhoods in Chicago: Looking Back a Decade Later.” The Journal of Criminal Law and Criminology (1973-) 107, no. 1 (2017): 131-160. doi:10.2307/48572210.
Ousey, Graham C., and Charis E. Kubrin. “Immigration and the Changing Nature of Homicide in US Cities, 1980-2010.” Journal of Quantitative Criminology 30, no. 3 (2014): 453-83. http://www.jstor.org/stable/43552161.
Vélez, María B., and Kelly Richardson. “THE POLITICAL ECONOMY OF NEIGHBOURHOOD HOMICIDE IN CHICAGO: The Role of Bank Investment.” The British Journal of Criminology 52, no. 3 (2012): 490-513. http://www.jstor.org/stable/44173503.